honolulu public transit access analysis
This project was done for a GIS class in college, where I chose to analyze how adequately (or inadequately) different areas of the island of O'ahu are served by Honolulu's urban bus system.
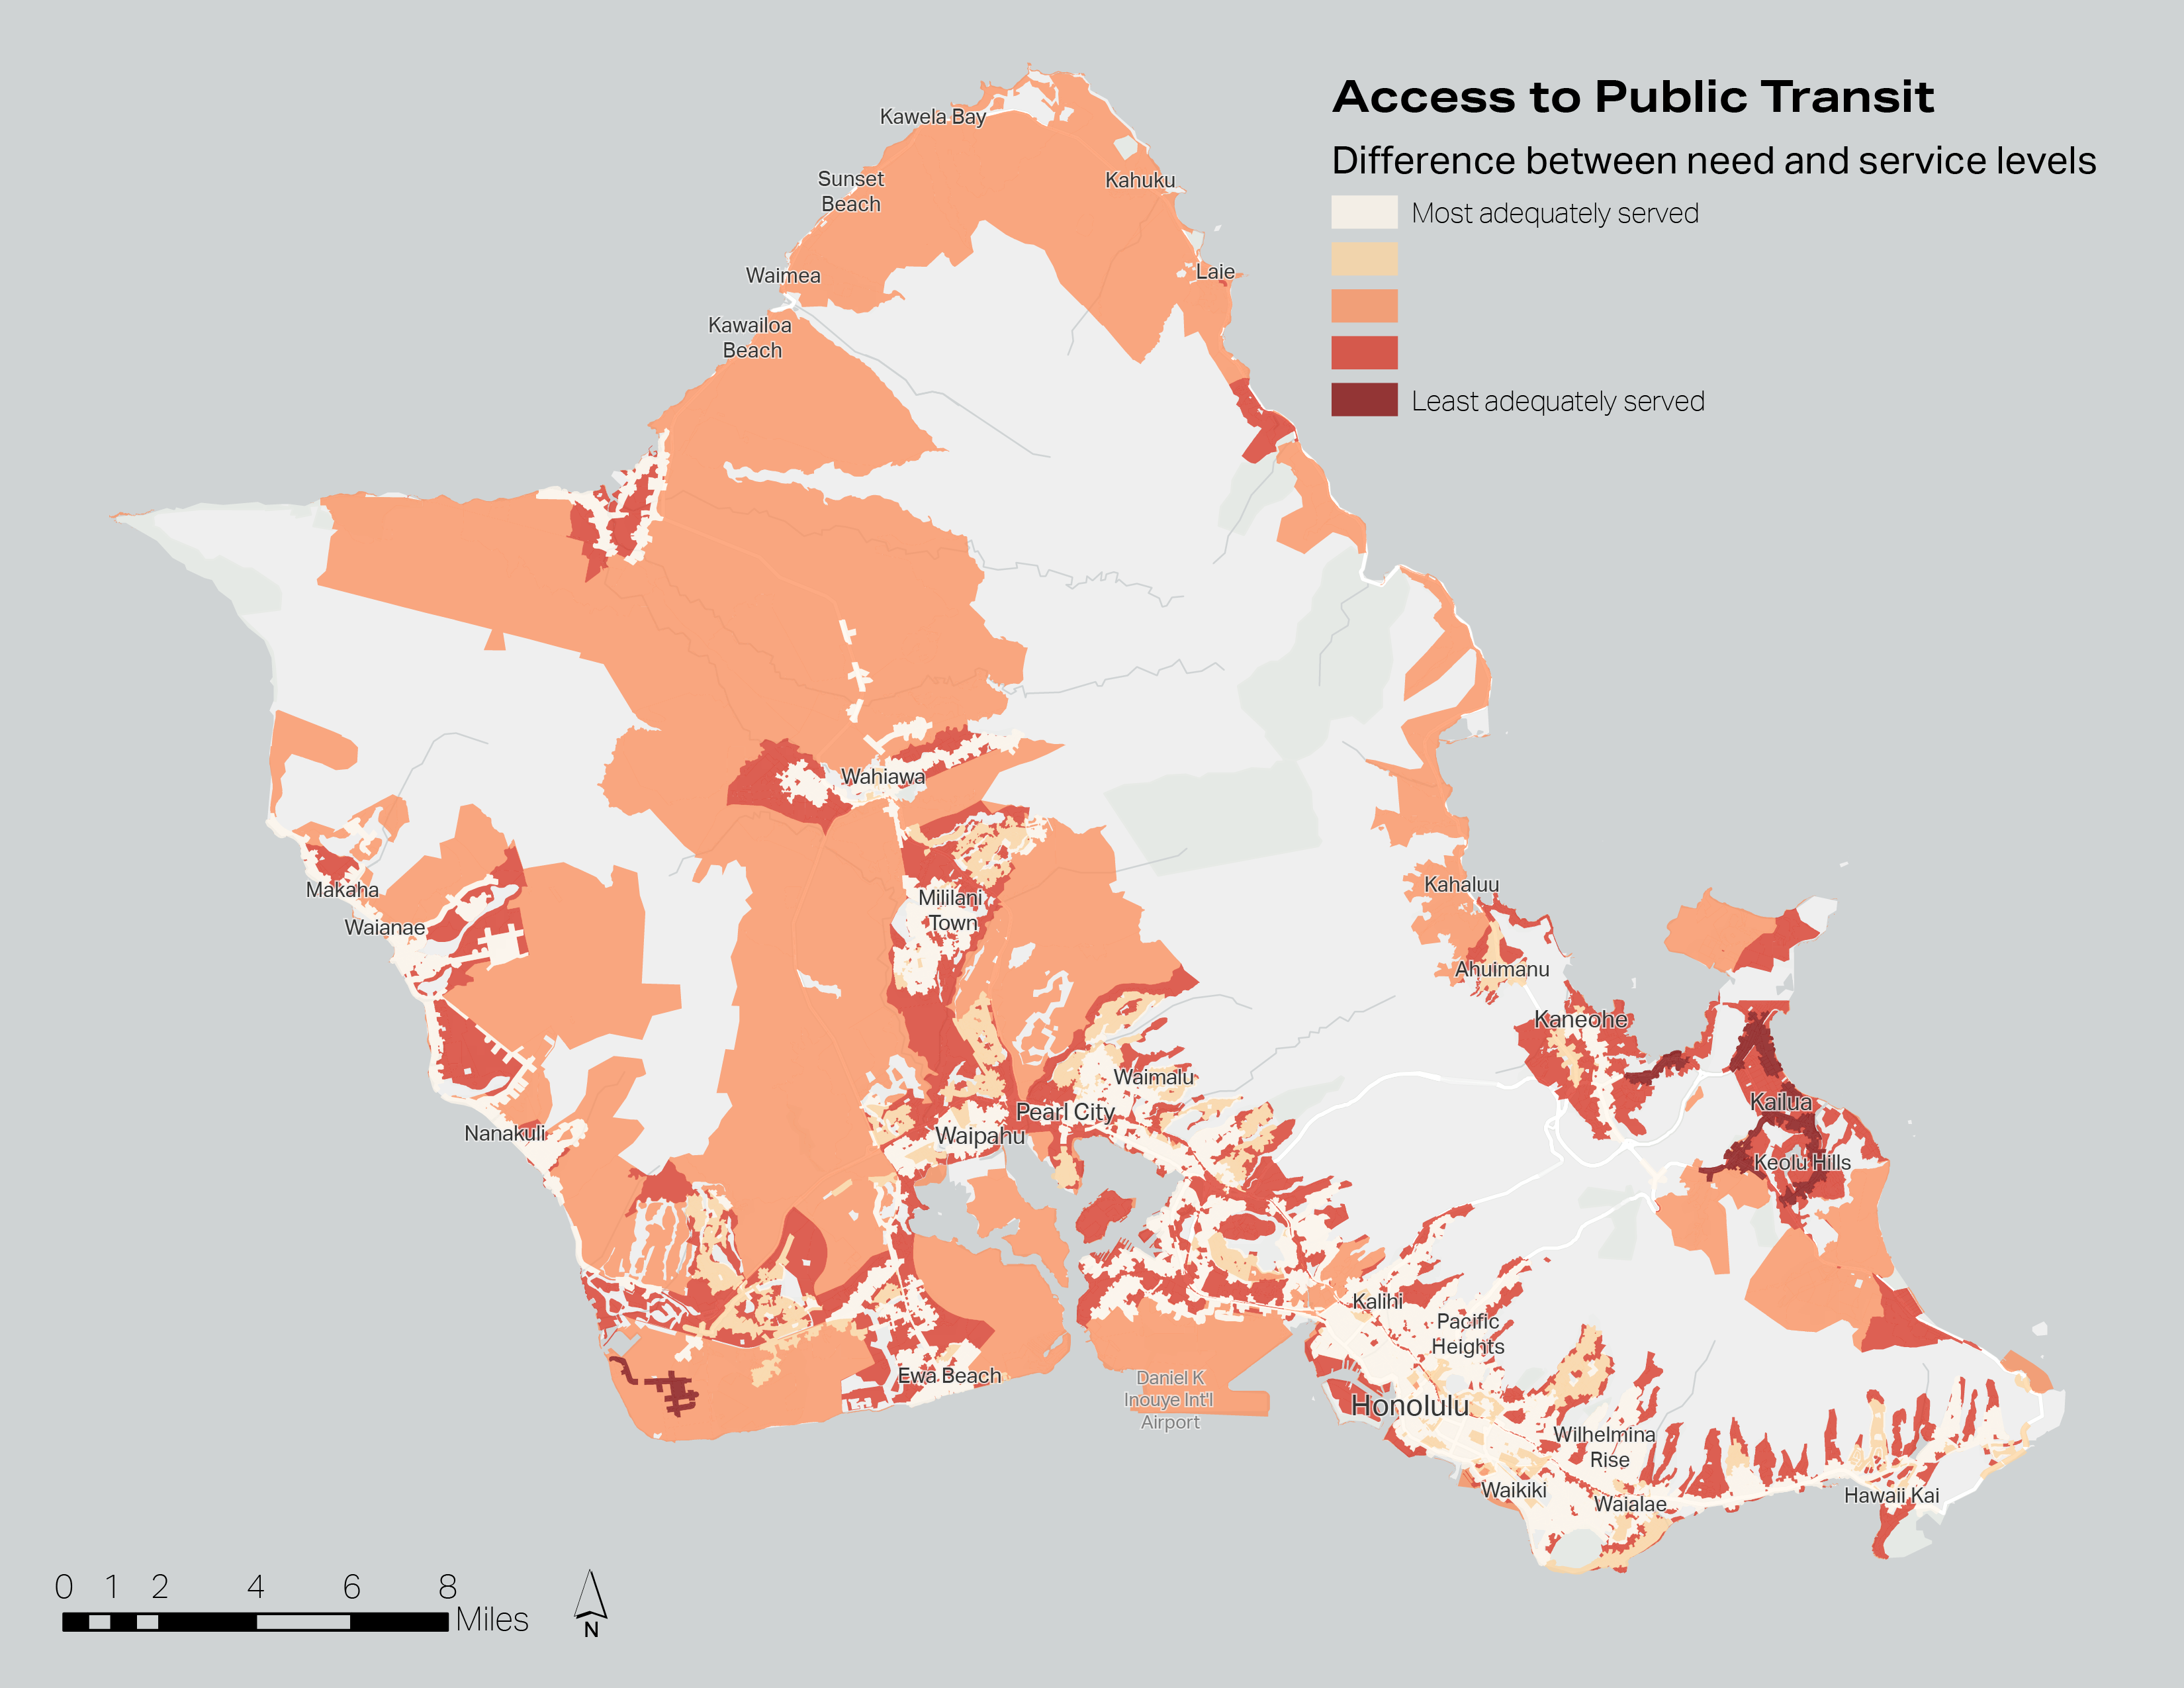
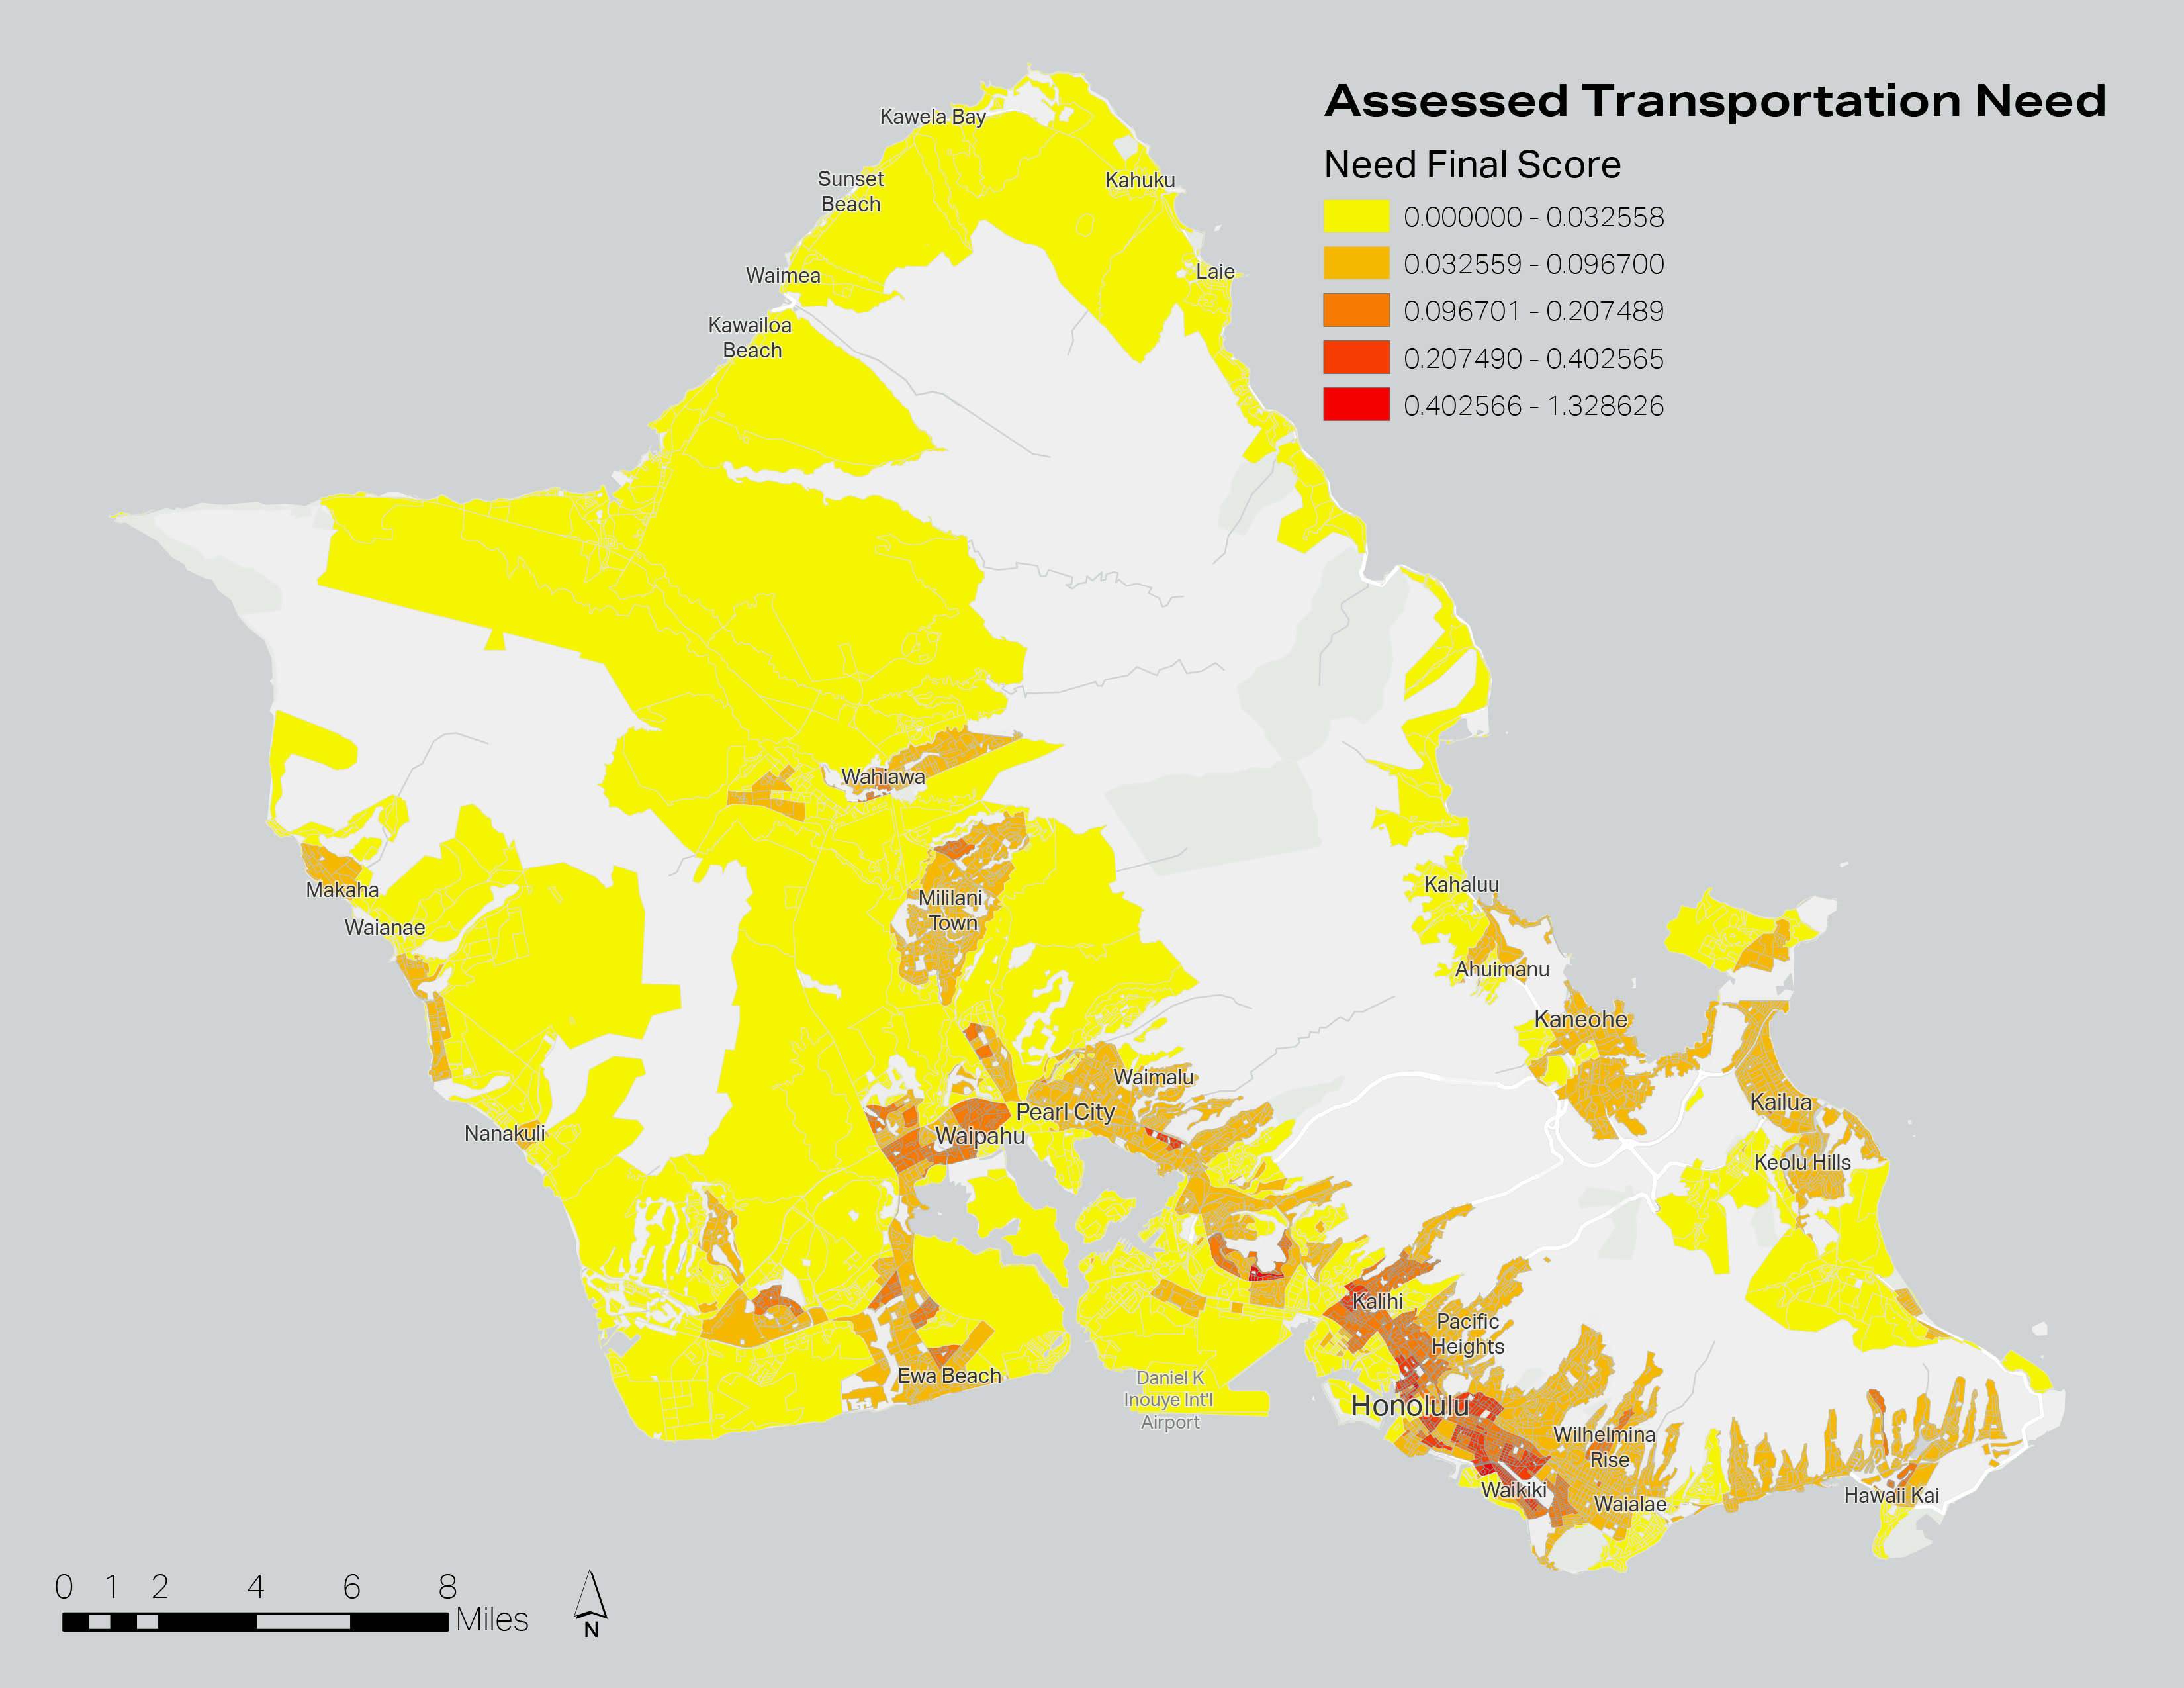
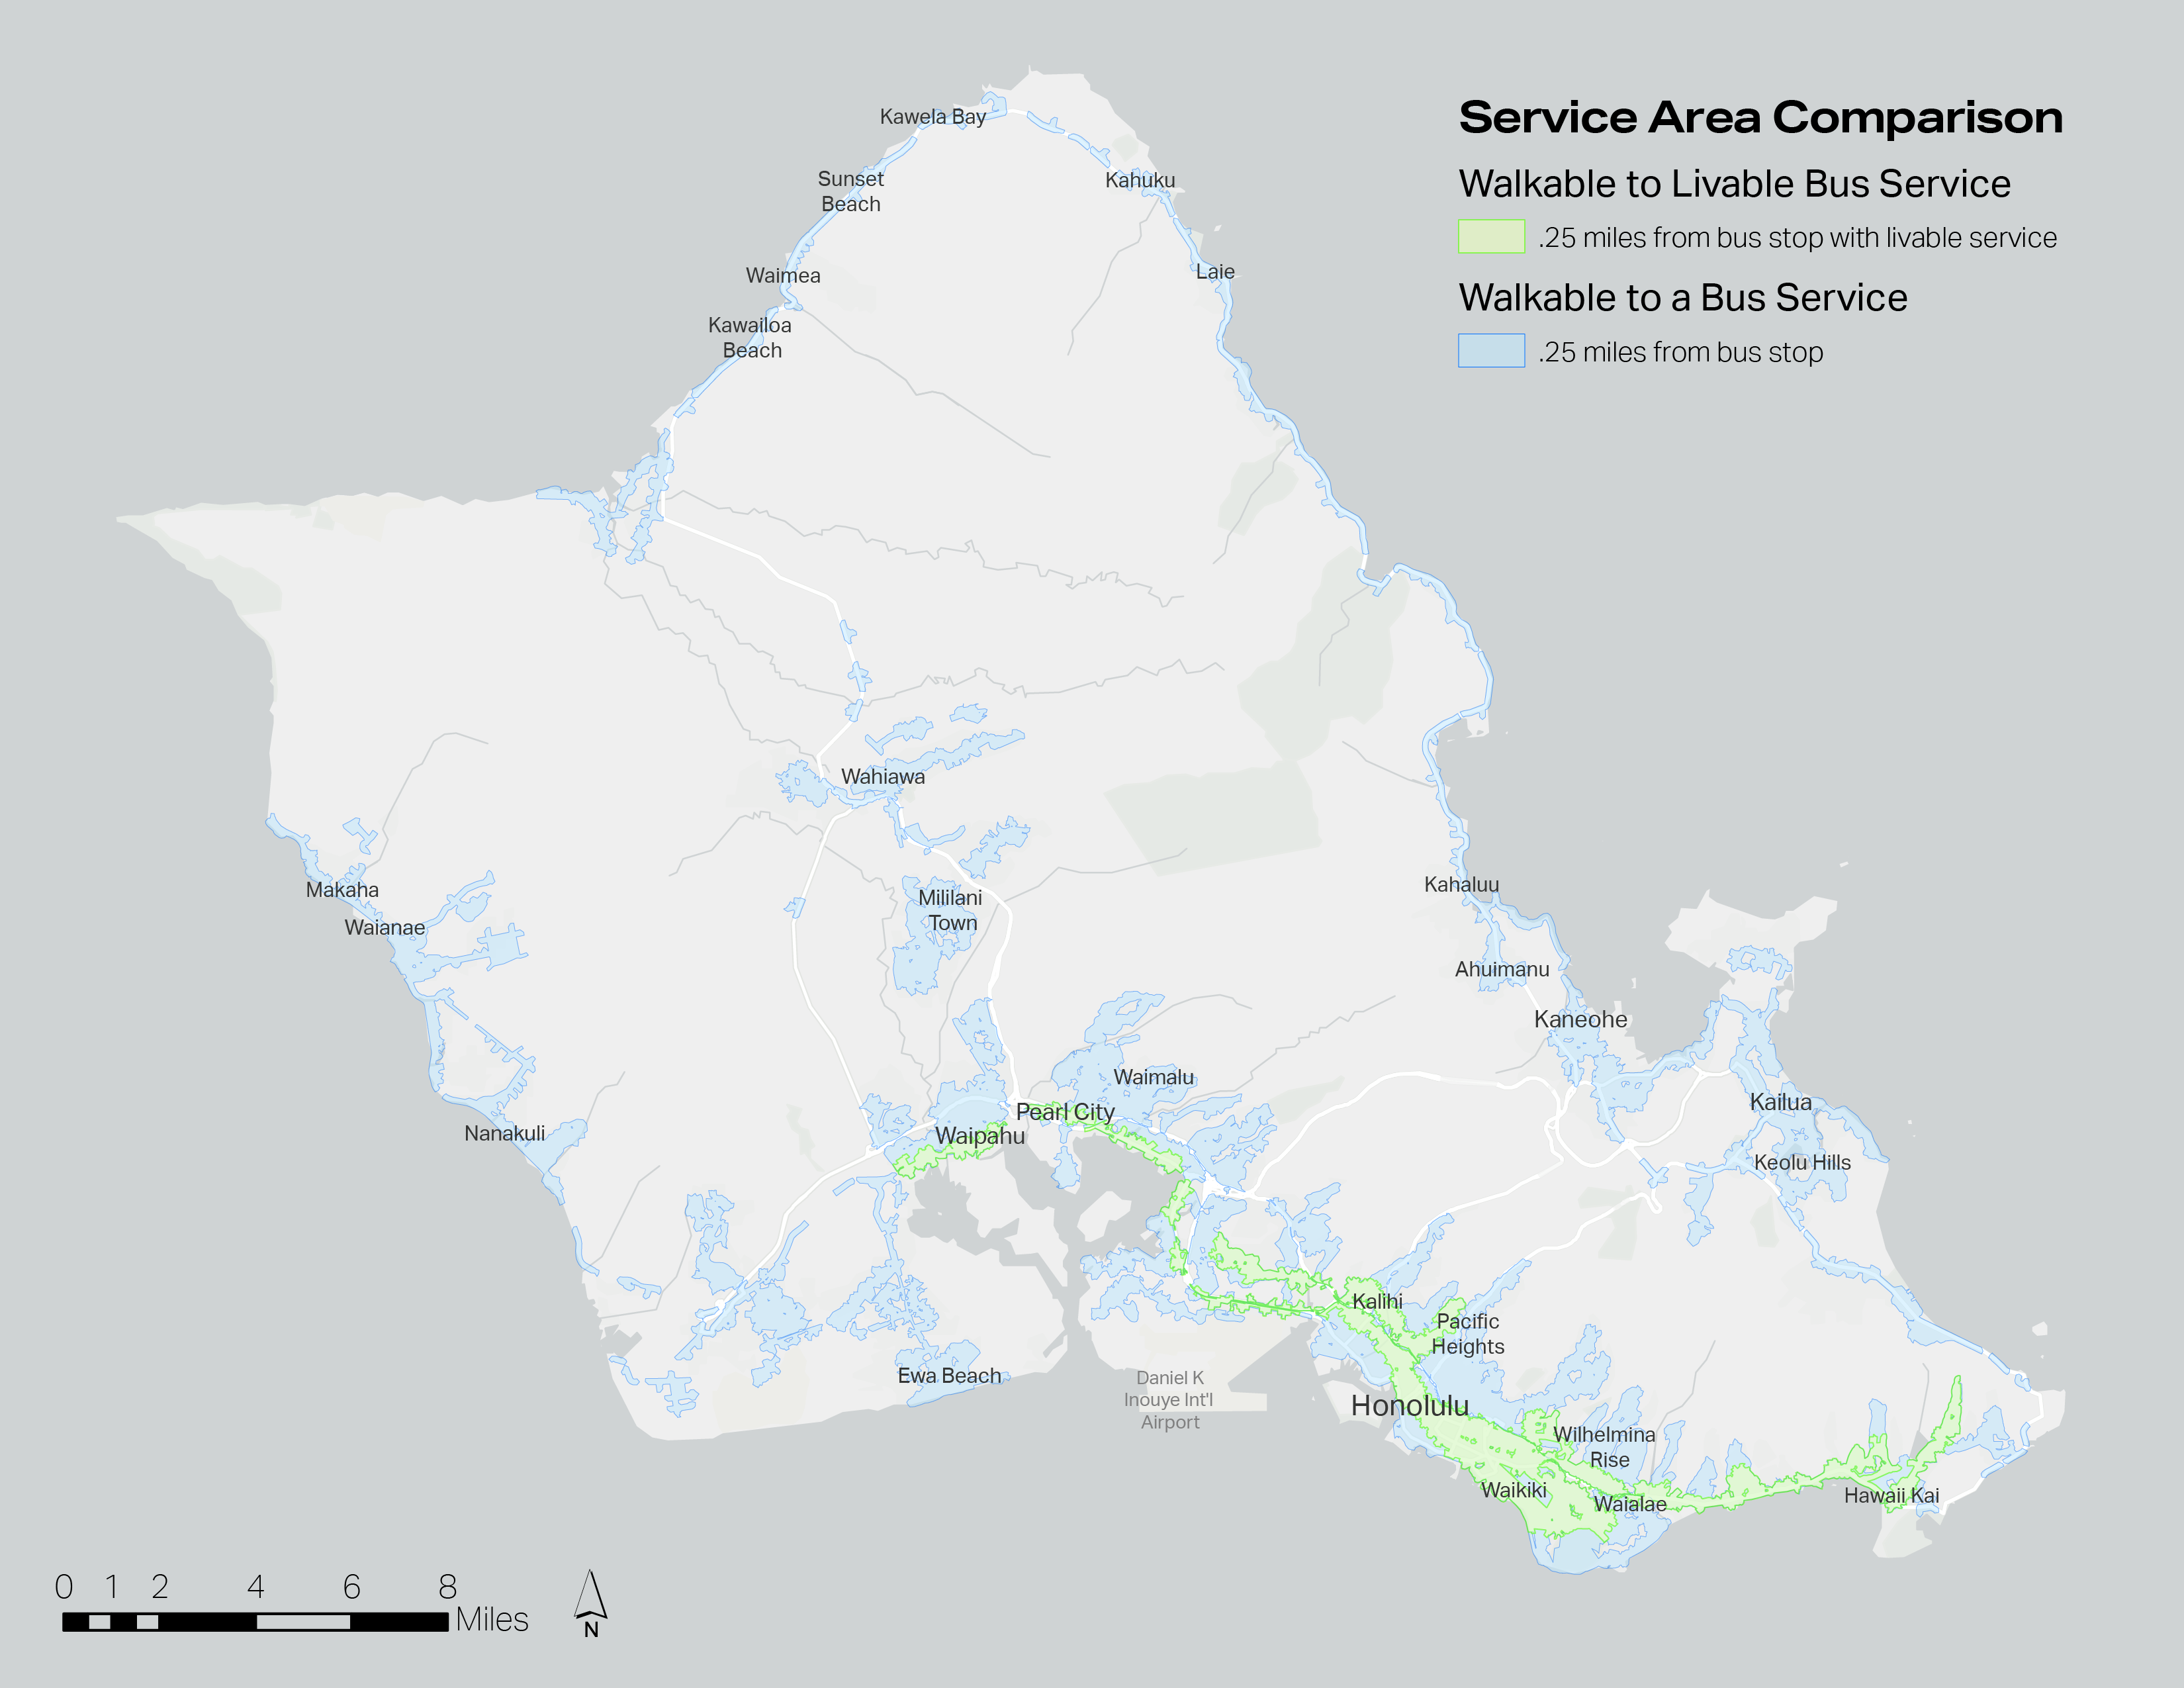
The final analysis showed that, while the most centrally located parts of the Honolulu metropolitan area receive relatively adequate, frequent service, there are large areas of the city which receive inadequate levels of service. These included areas such as West Oahu, East Honolulu, and Kaneohe/Kailua.
Analysis was done through a combination of methods, using information from the US Census Bureau, the City and County of Honolulu, and Oahu Transit Services (operators of TheBus and related services.)
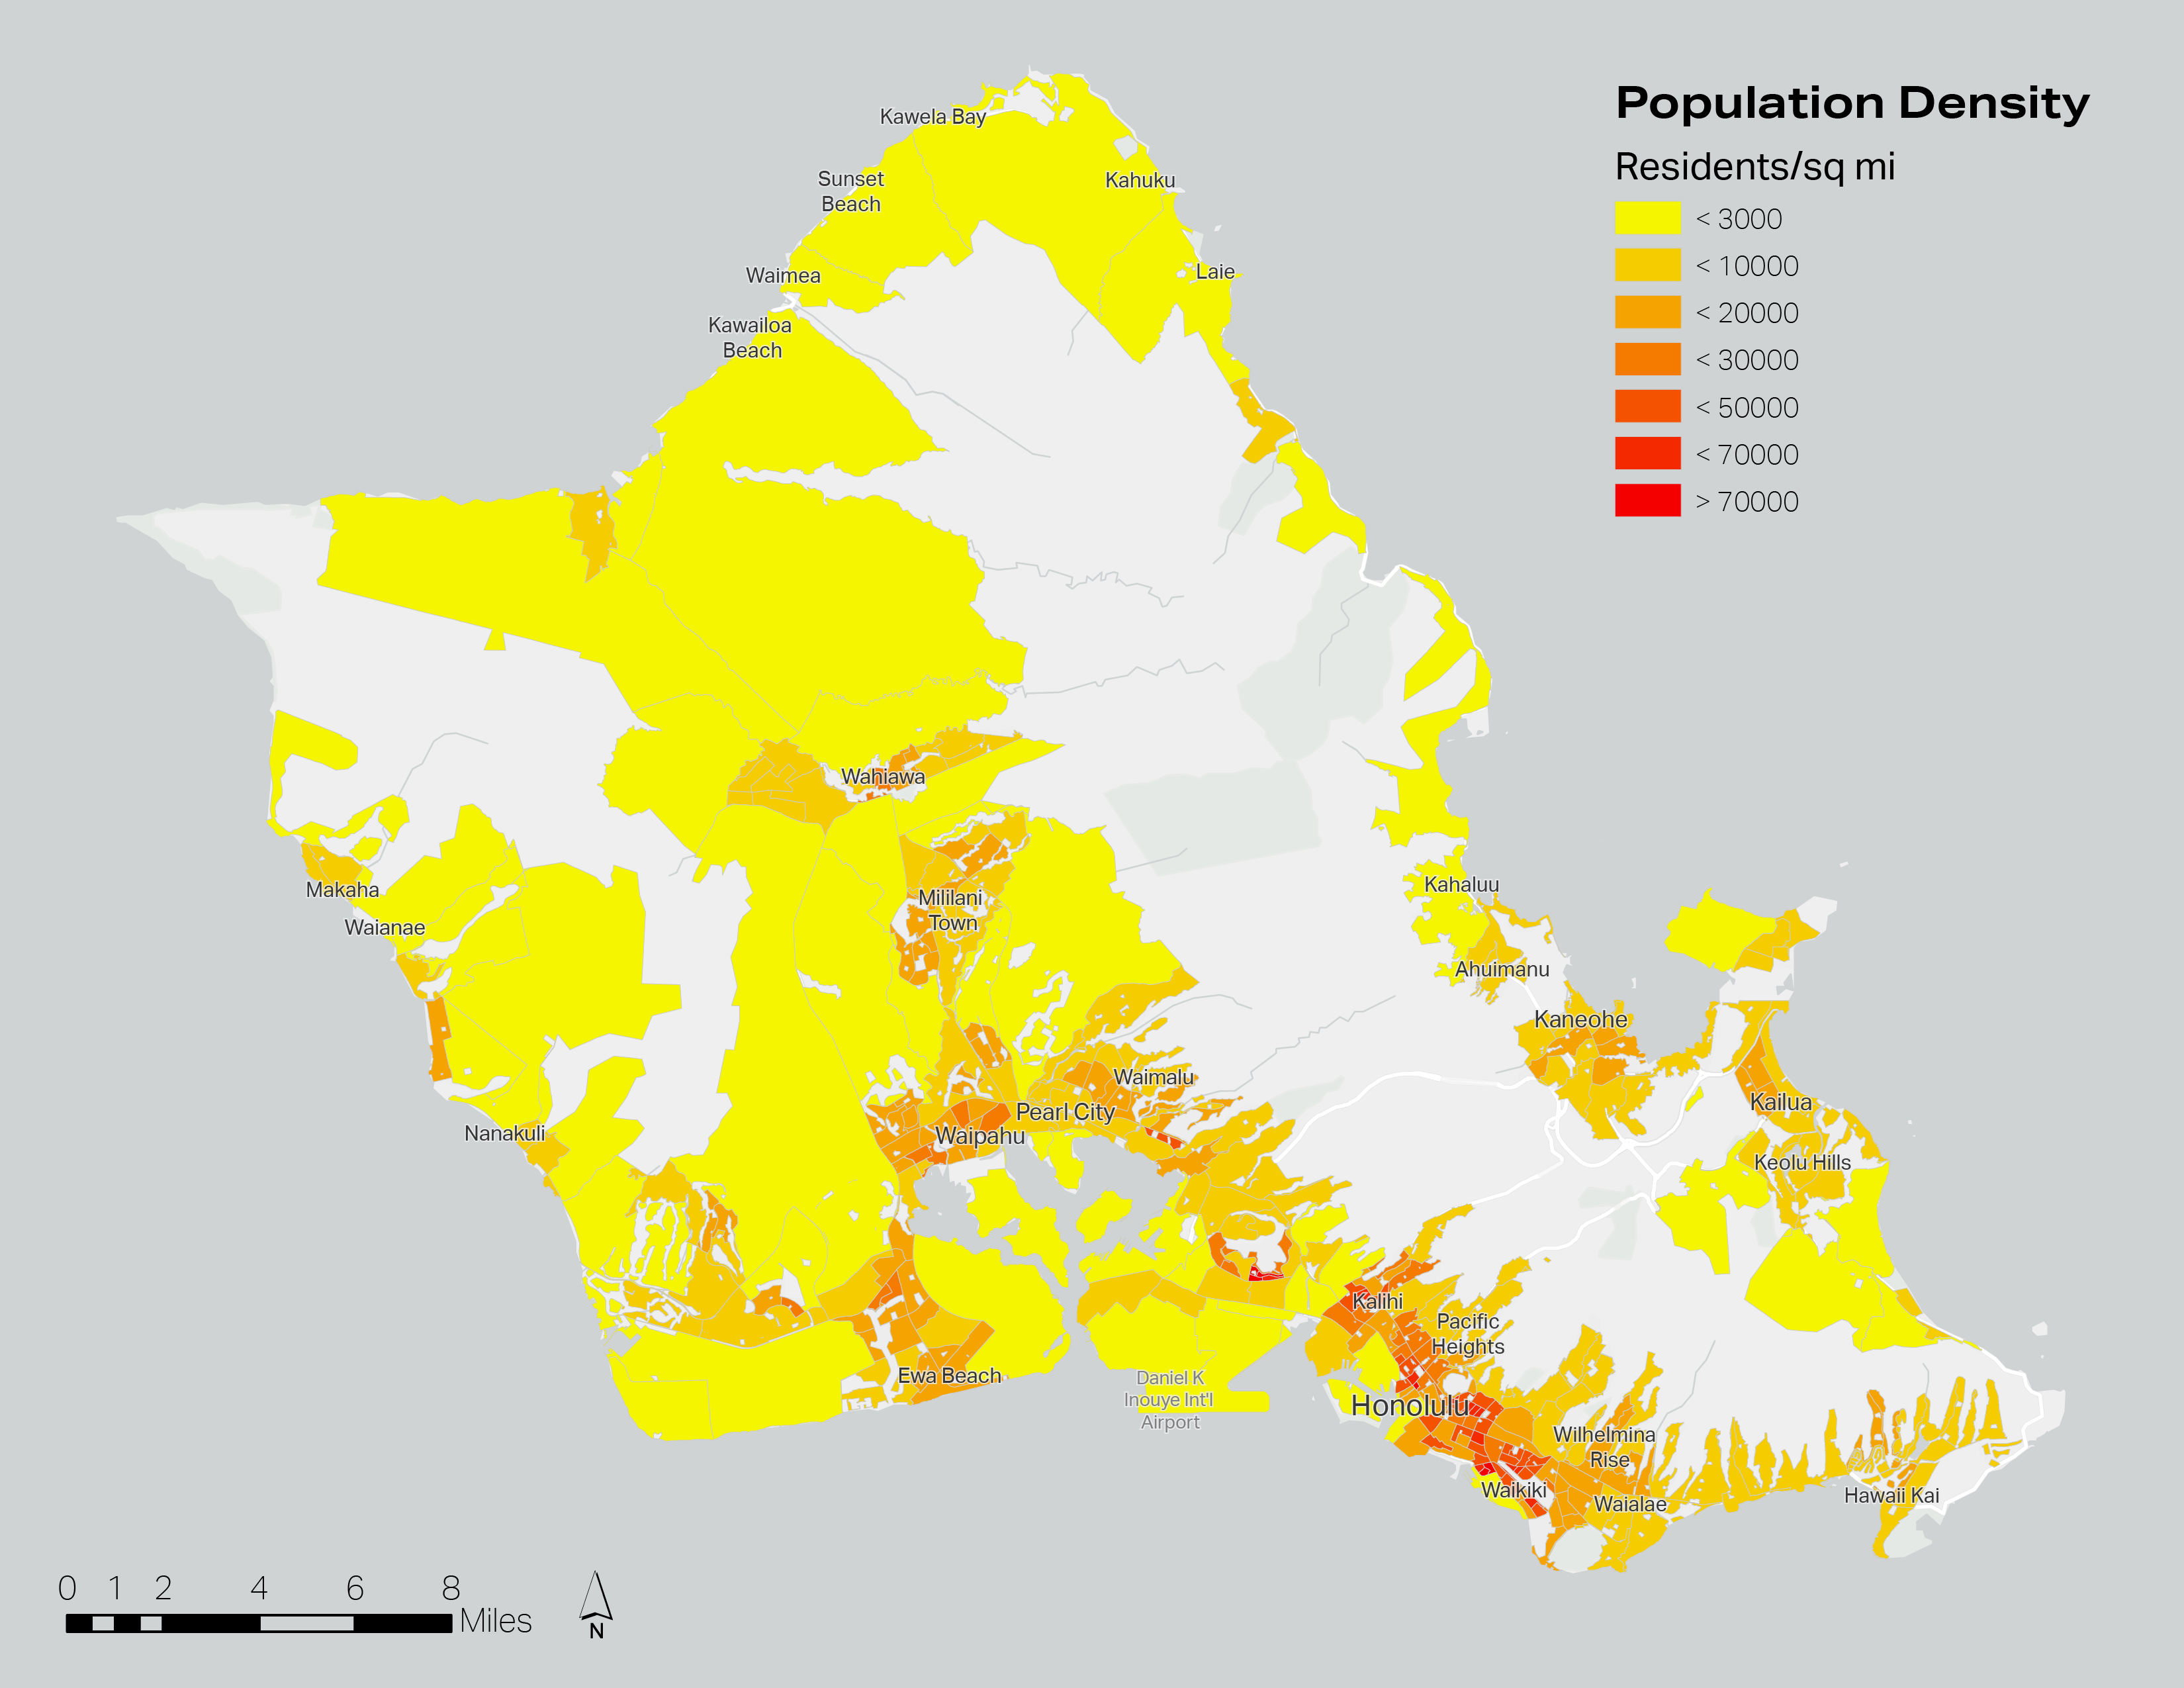
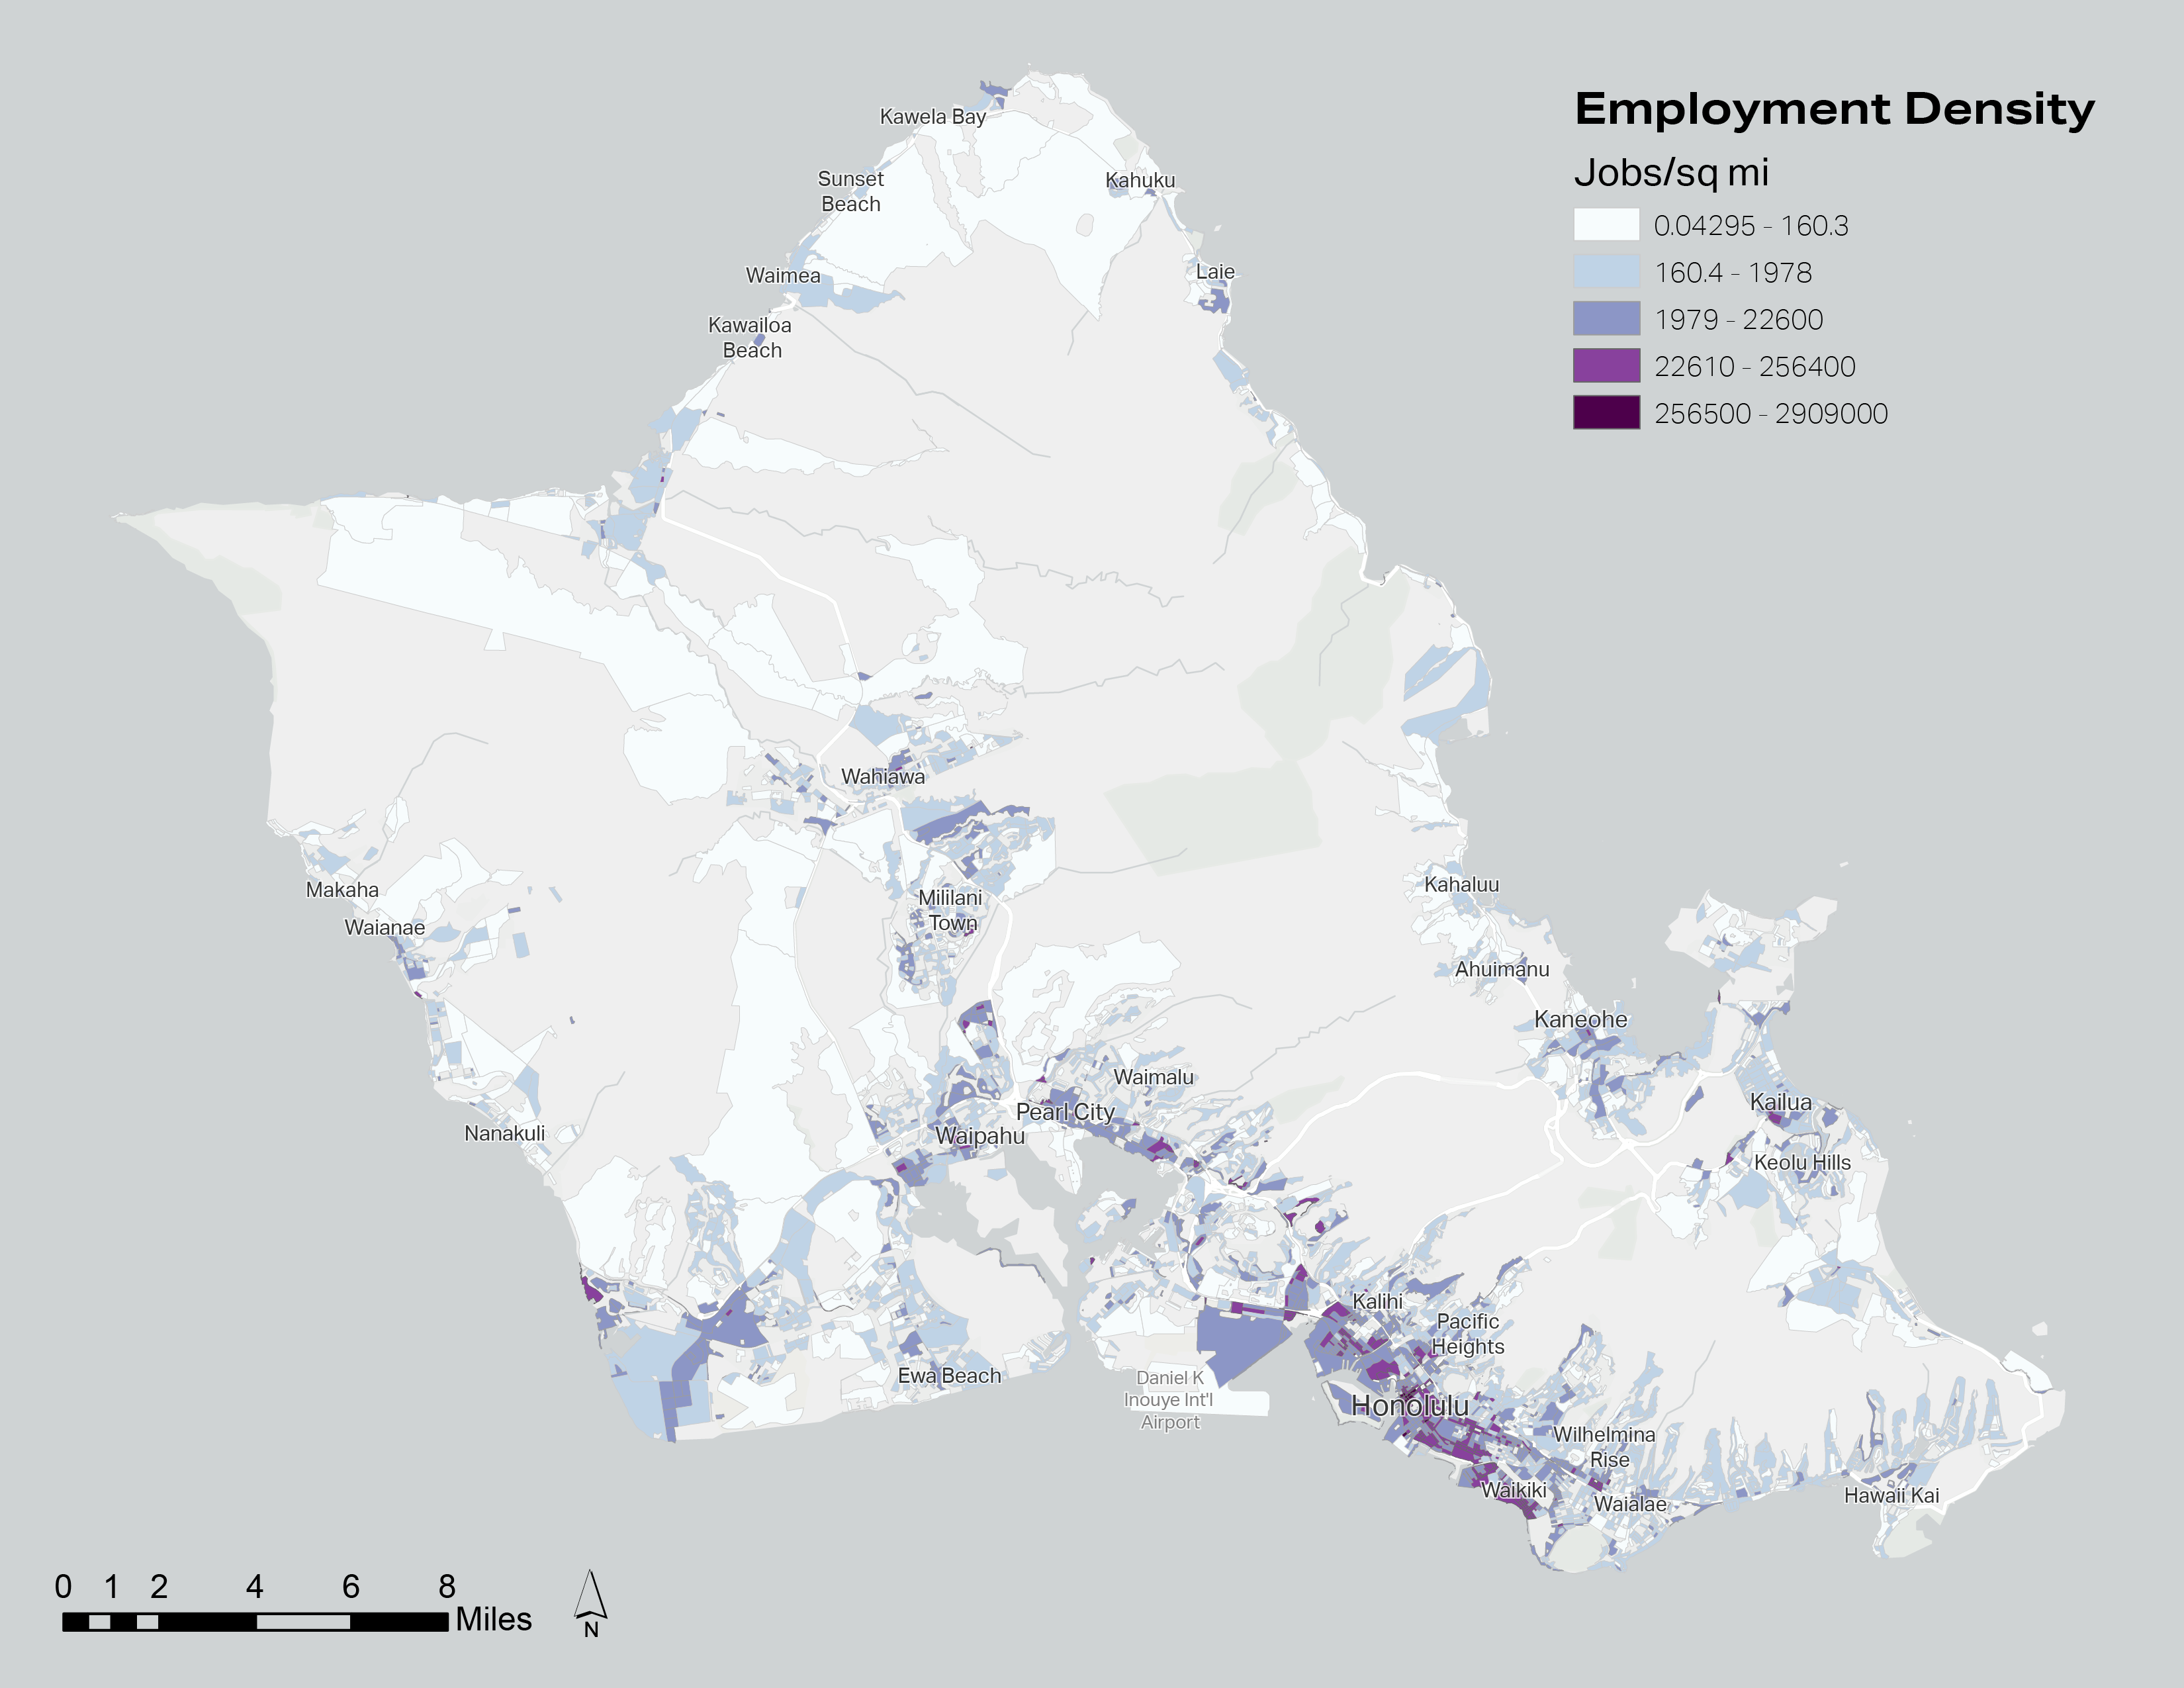
The first step of the analysis was to calculate a "level of demand" for transit service in each part of the city, at the census tract level. This was done by combining population density and employment density of each tract in a weighted suitability analysis.
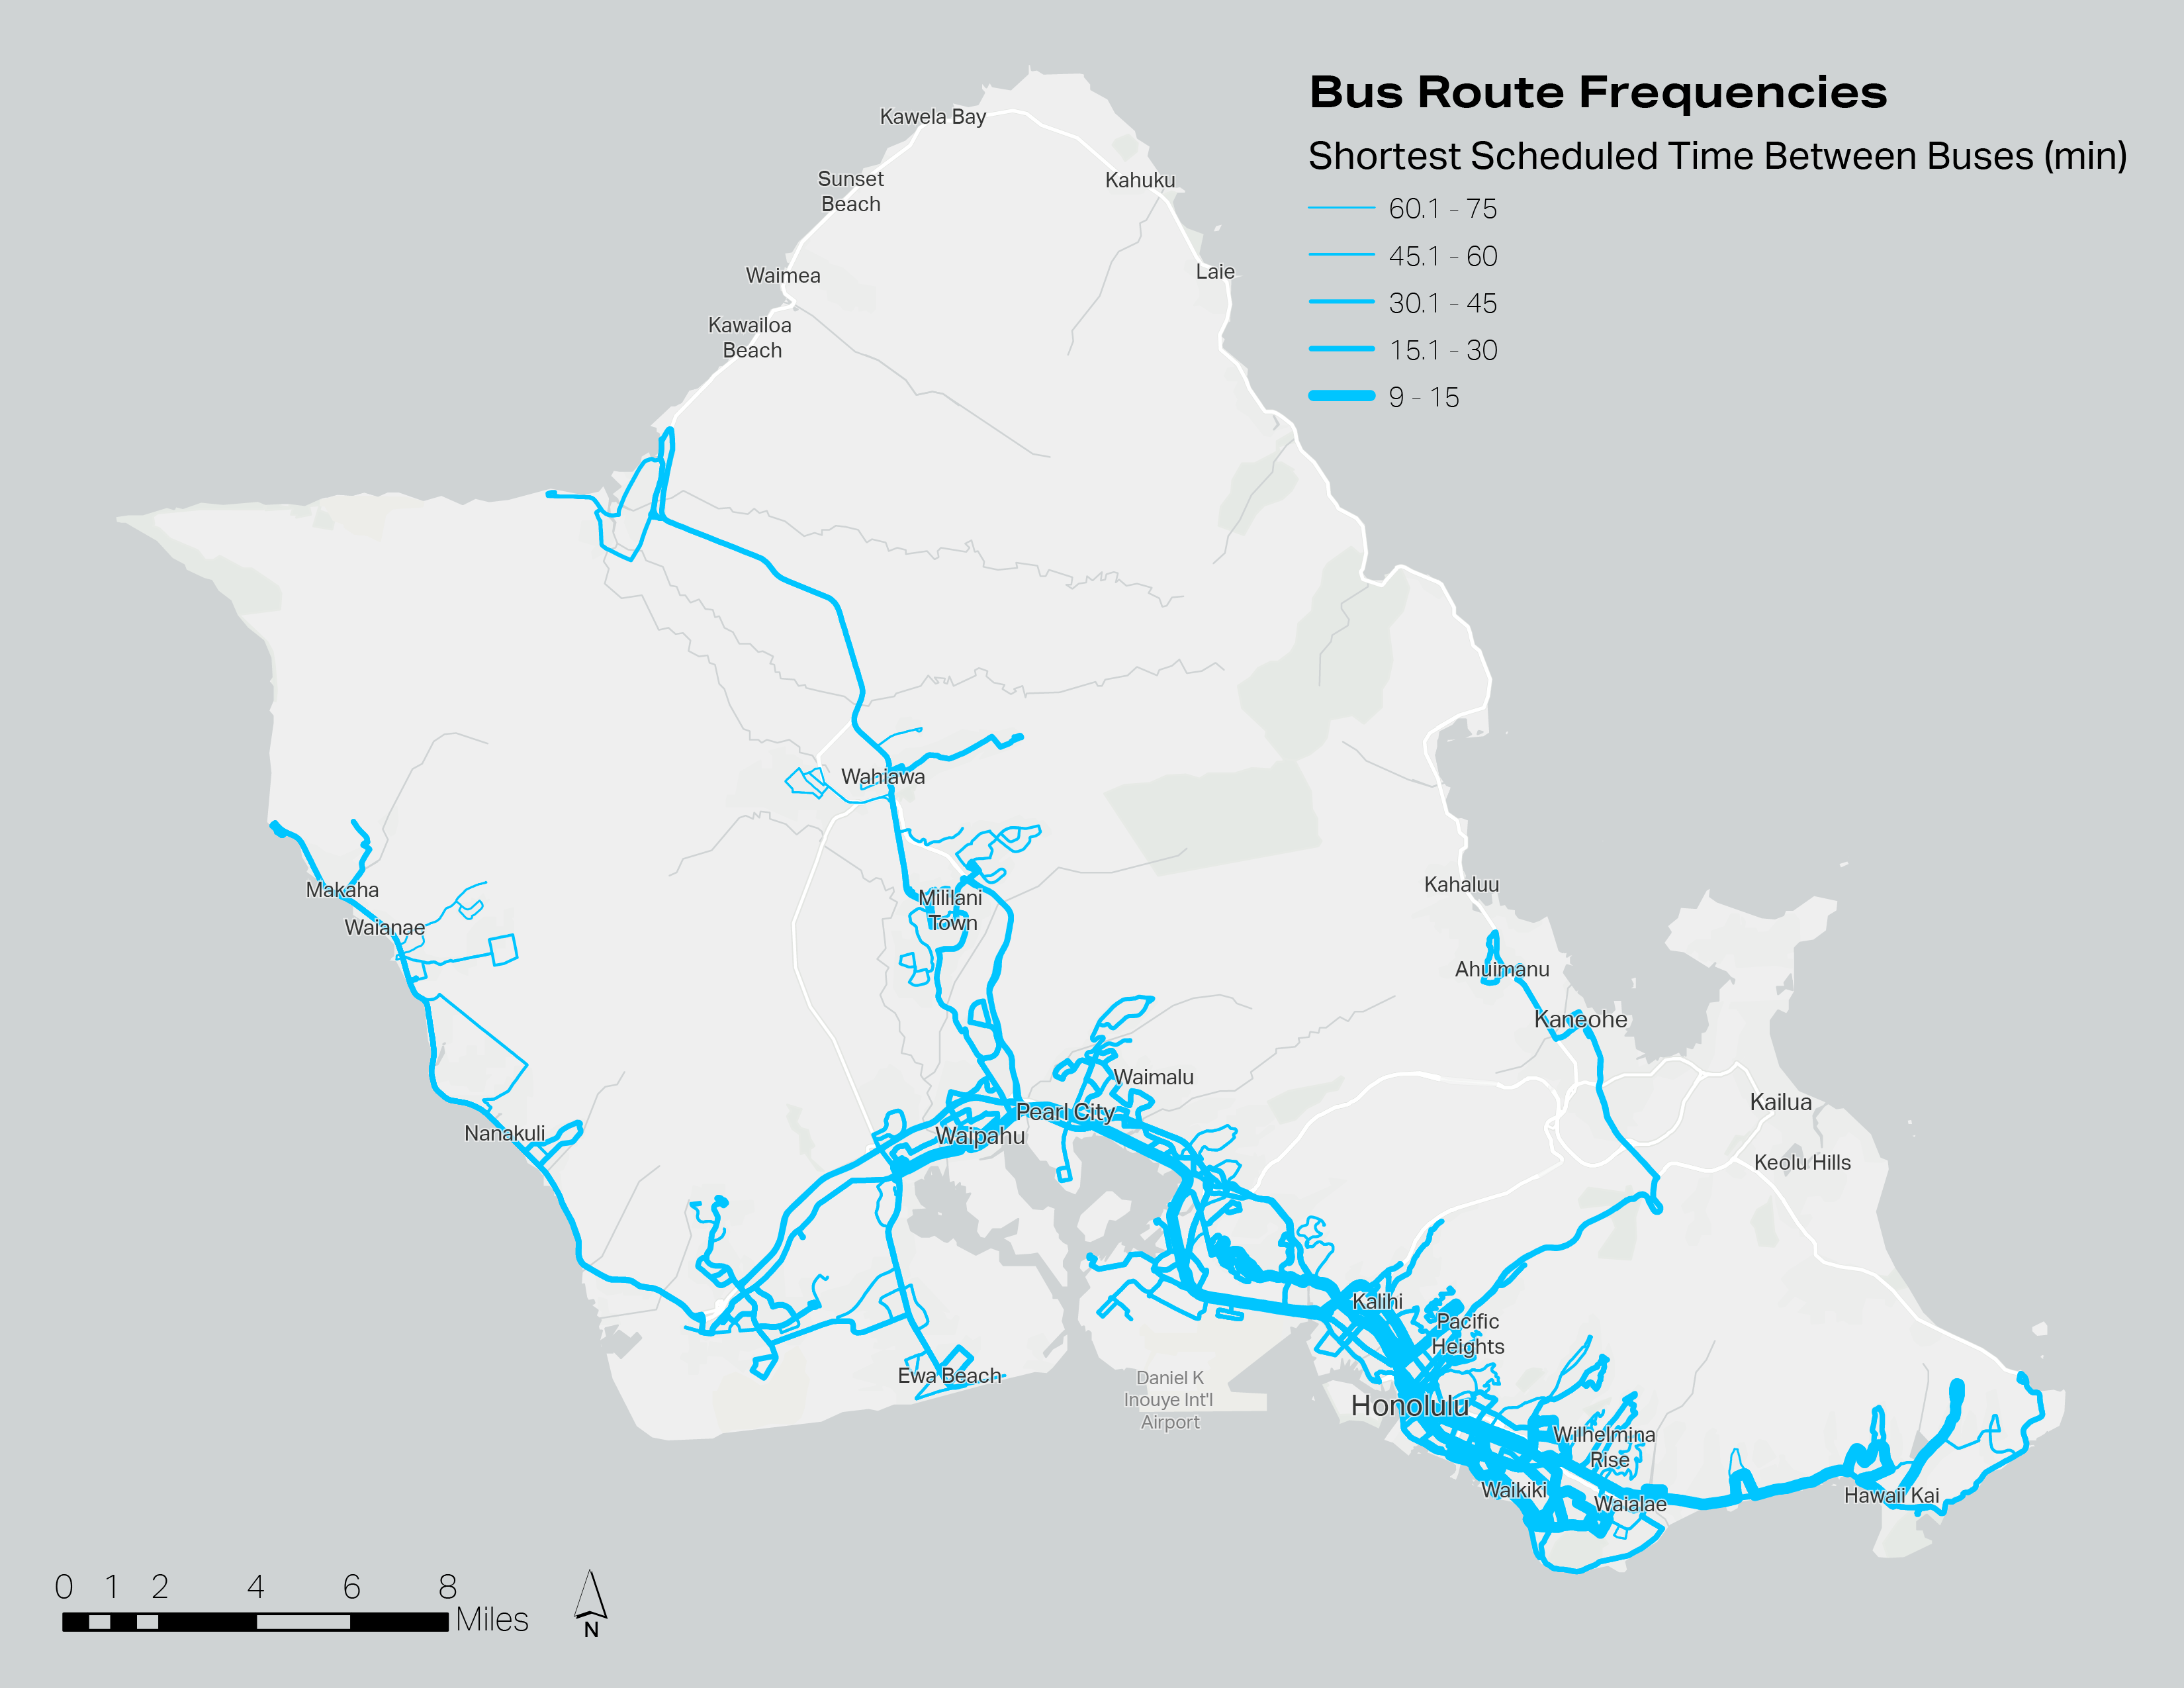
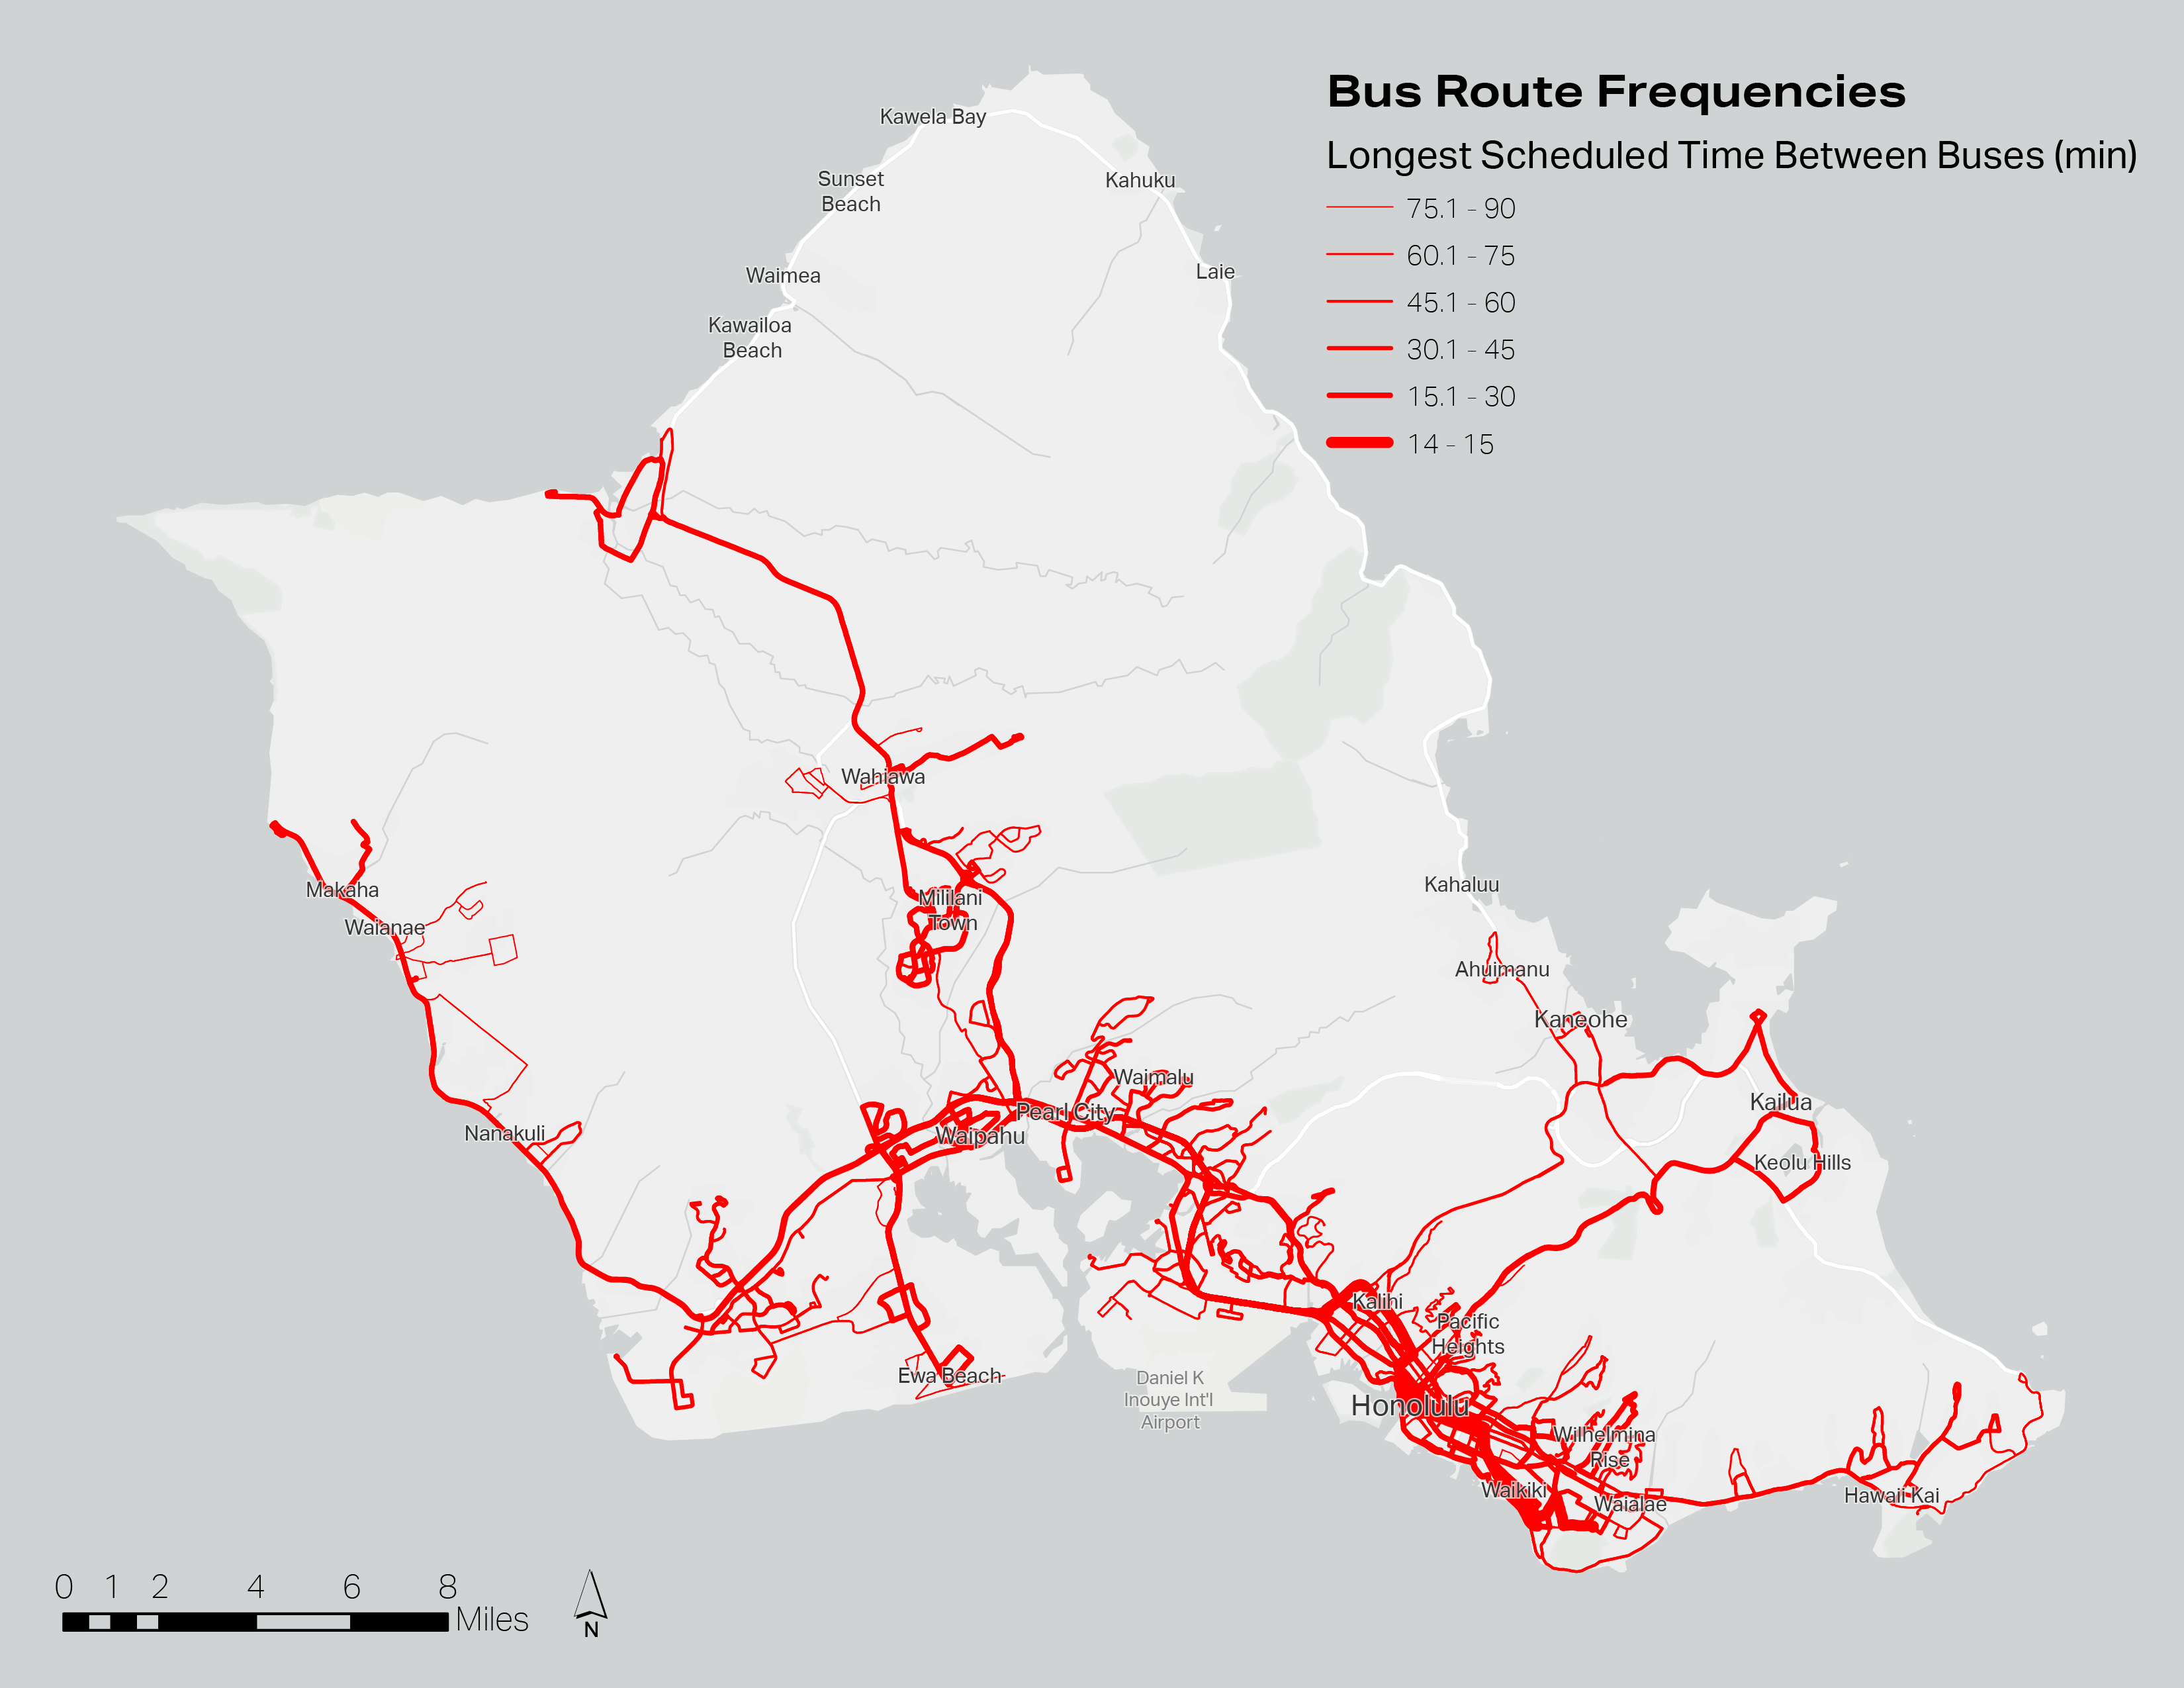
Next, a "level of service" for transit was calculated by accounting for the highest and lowest frequencies of service at each stop for each route, the 1/4 mile walking catchment area of each bus stop, and the discrepancy between the highest and lowest levels of frequency on each route (with routes receiving a penalty for higher differences.) The dataset that was used in ArcGIS to display route frequencies as an attribute of each route was copied by hand from TheBus's 2019 timetable system map.
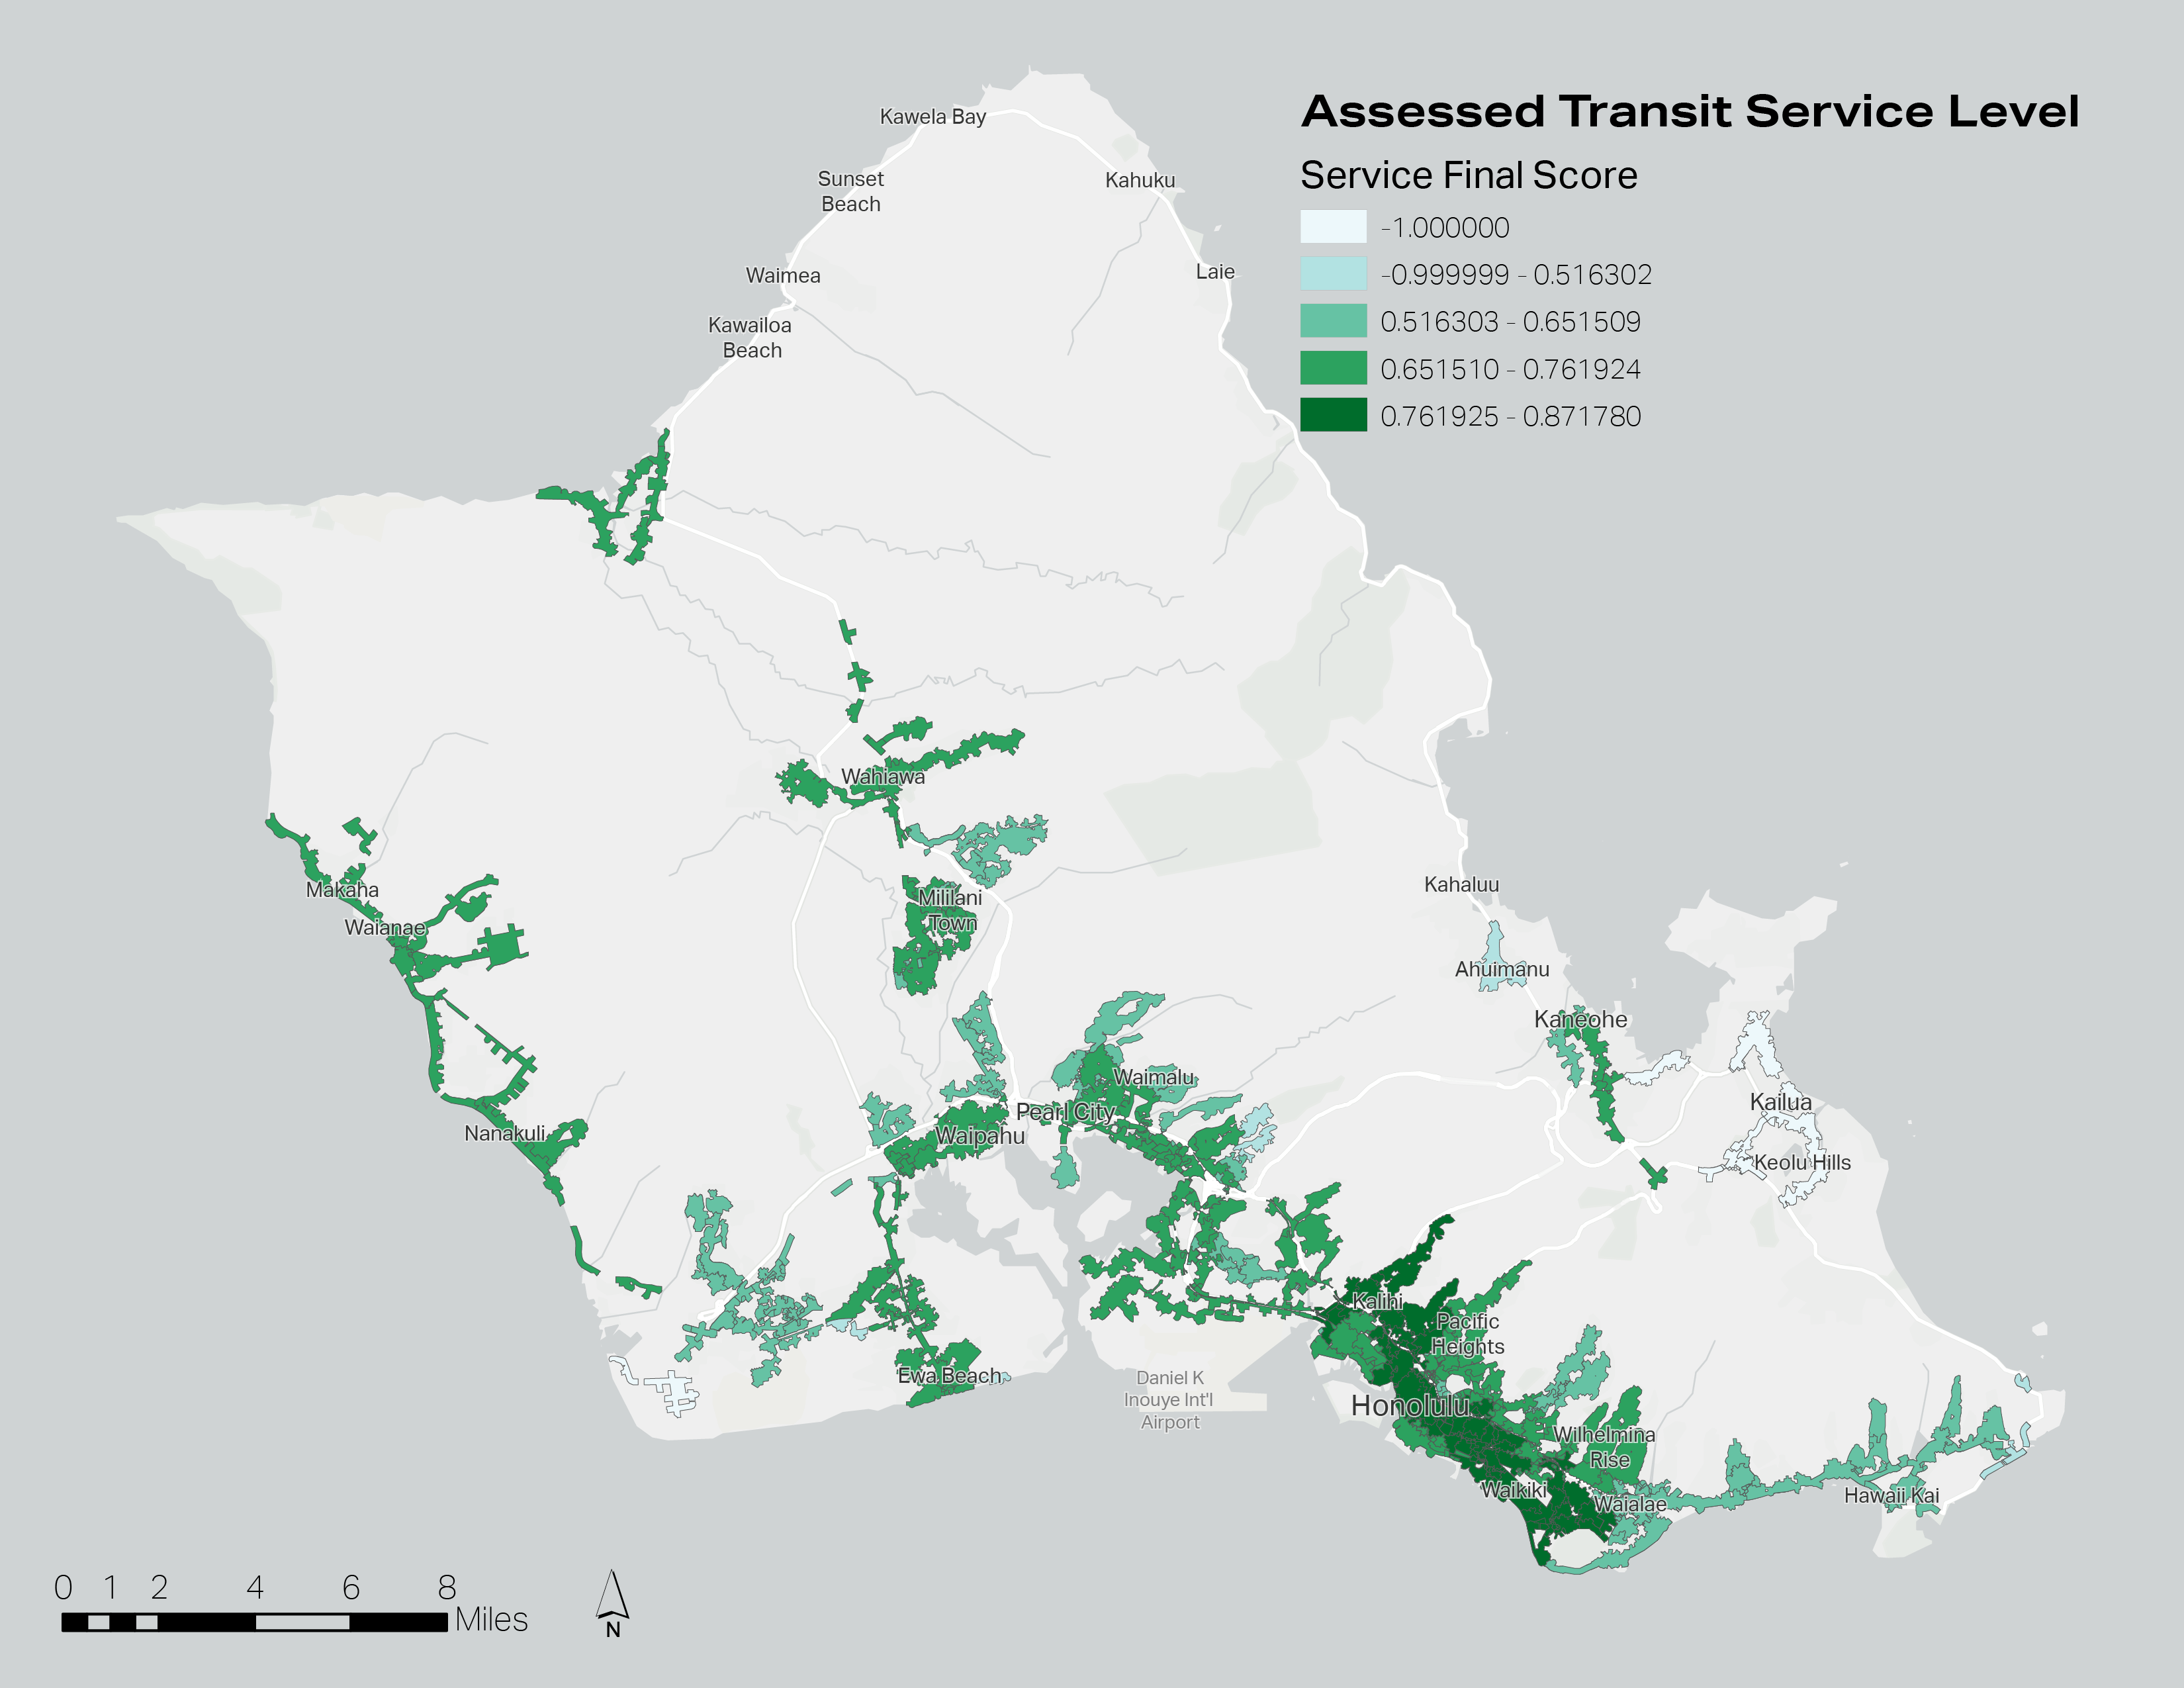
Finally, the "transit service" score was subtracted from the "transit need" score for the entire island, leaving the difference between the two as the metric by which to measure how adequately served a neighborhood is.